This photo essay consists of infographis drawn on analysing contributions to Science & Technology Studies from 1988-2018. Information on year/issue/number/journal section, author name, geography, gender, and disicplinary orientation was collected and analysed for arriving at gender, geographical and disciplinary distributions.
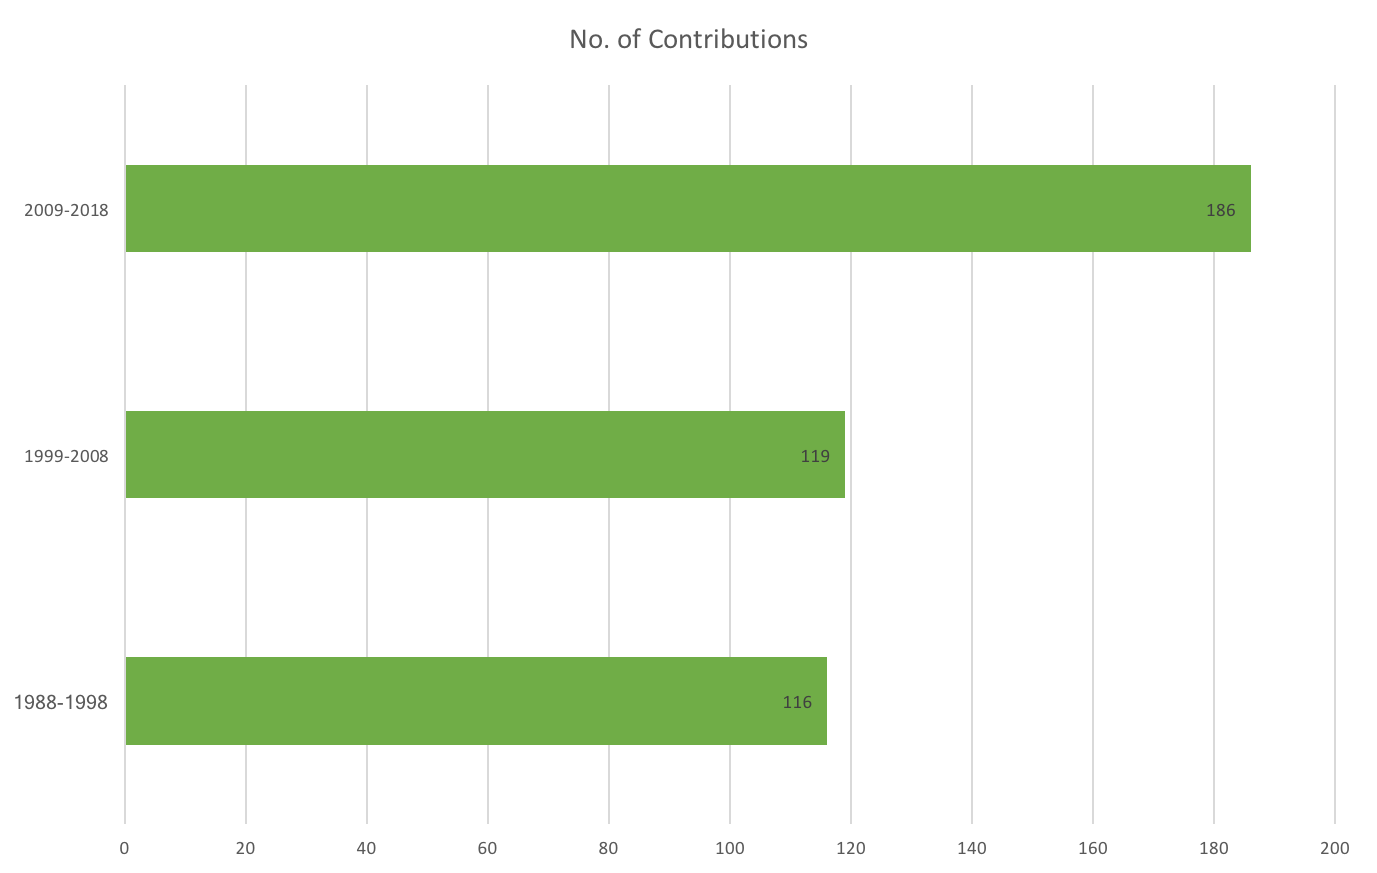
This bar graph compares decade-wise total number of contributions to Science & Technology Studies. The total number of contributions rapidly arose in 2000s, from 116 in 1988-1998, to 186 in 2009-2018.
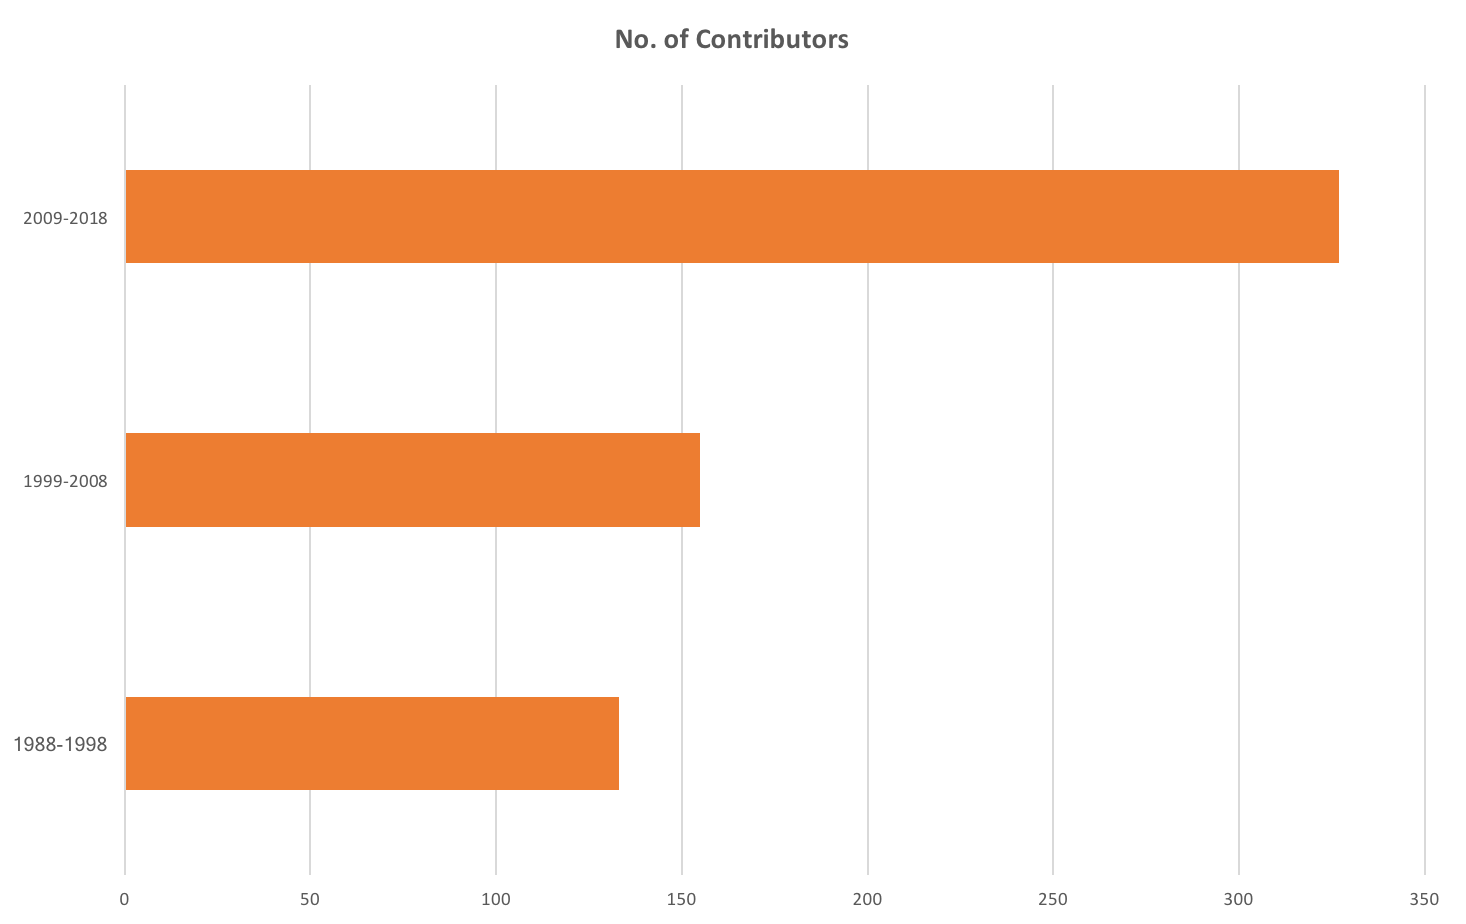
This bar graph compares decade-wise total number of contributors to Science & Technology Studies. As the number of contributions rose, so did the number of contributors. In 2013, the journal expanded to include three issues per year, and number of special issues also increased.
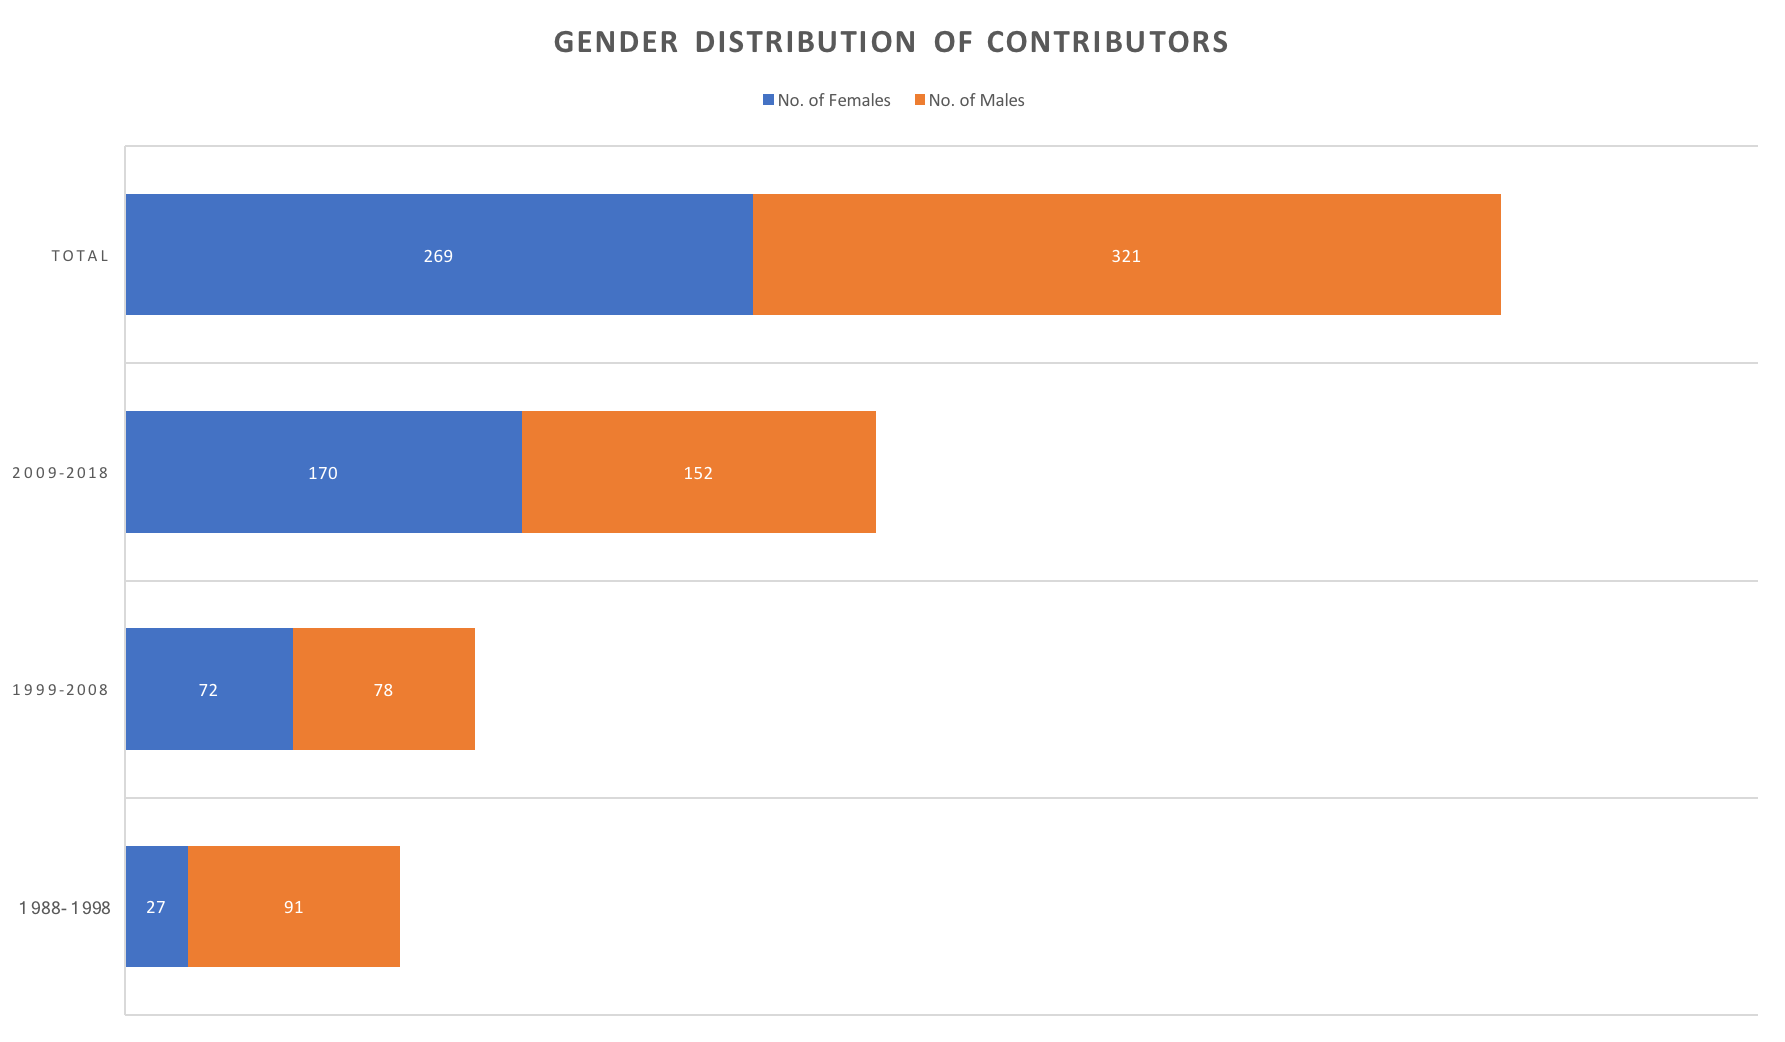
This stacked bar graph compares gender distribution of contributors across for three decades Science & Technology Studies. According to Salla Sariola,
If the journal’s own numbers are an indication, of the current editorial team, 50% of the members are women and in the journal’s history, four of the six coordinating editors have been women. Of the authors publishing in the journal throughout the 30 years, 46% have been women. During the first decade, the difference was as unequal as 77% of men to 23% women. More recently, however, since year 2009, the number of women authors becomes slightly higher than men at 53%.
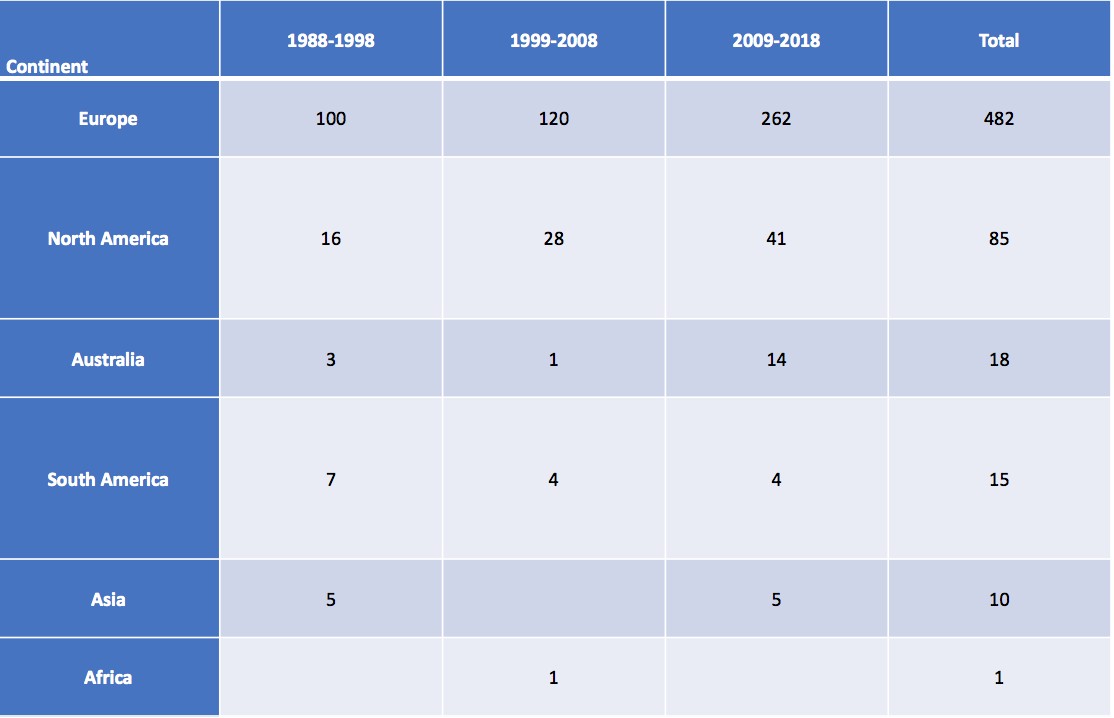
This infographic tabulates the continental distribution of contributors to Science & Technology Studies. Coordinating Editor Salla Sariola writes,
As the long list of authors’ locations attests to, the journal’s content scope is global. Indeed, research is reported from further sites and locations as well: translation of STS concepts across different cultures, epistemic traditions, and systems of practice, also beyond the ‘developed world’, has been a topic that authors in S&TS have contributed to...
Work remains to be done, however, to encourage authors based in African countries to be present in the field and to reflect upon intersectionality in STS, both in the topics of study as well as STS’s own knowledge production practices.
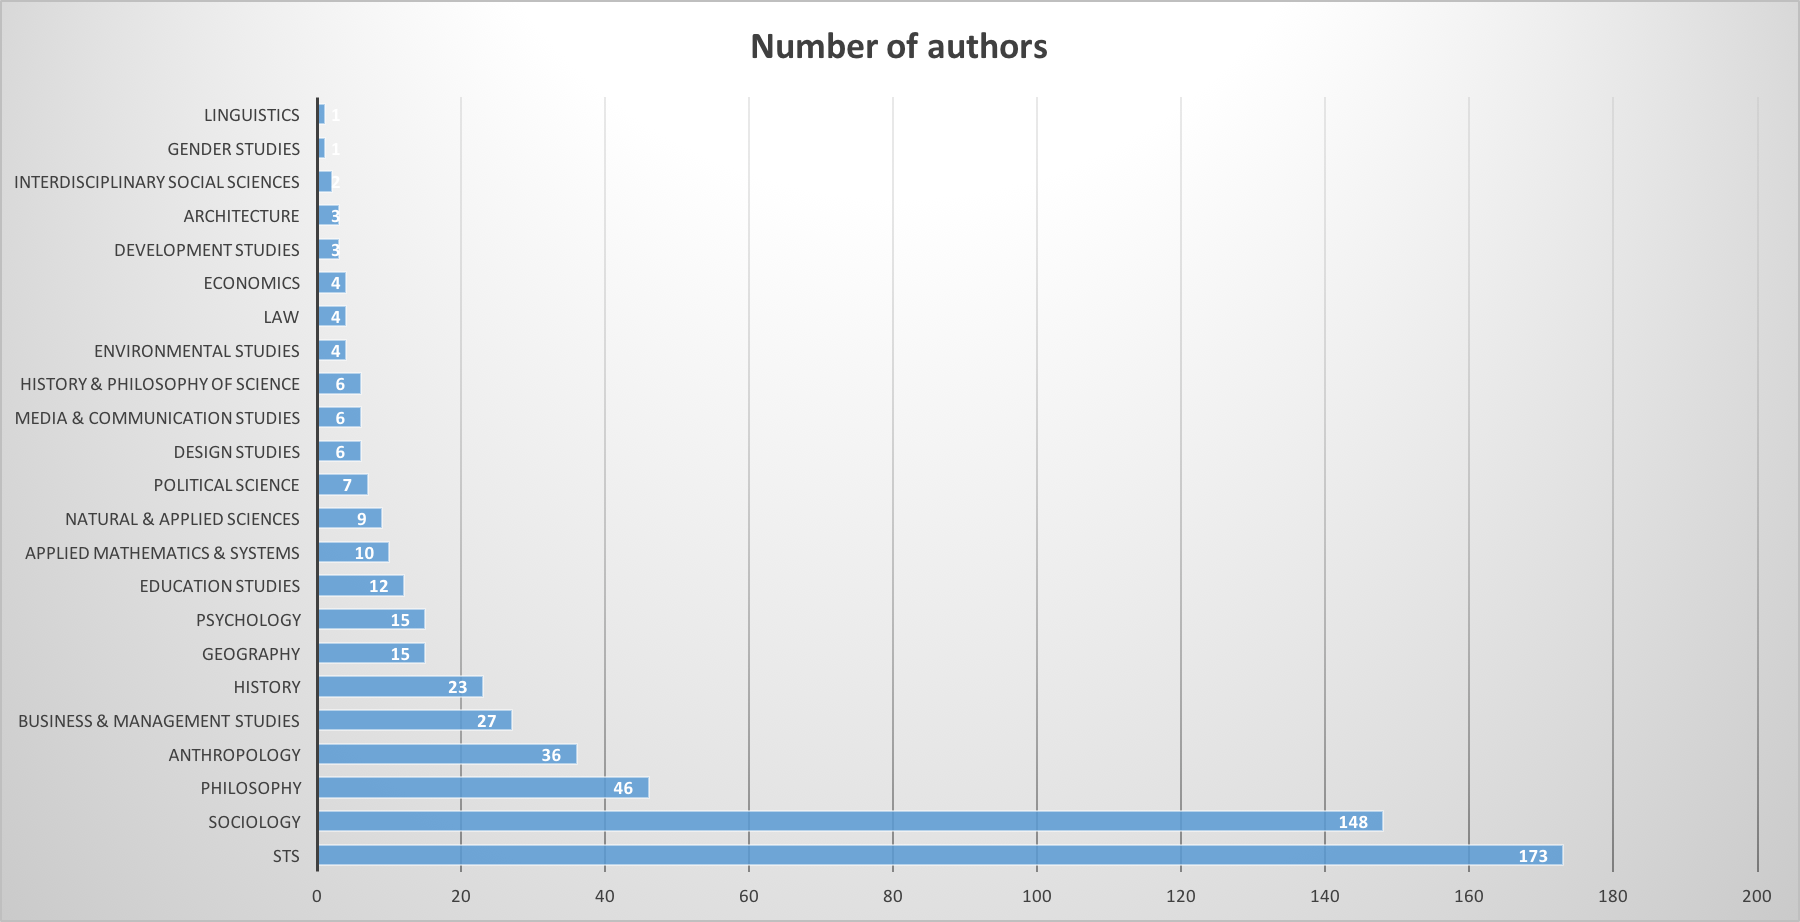
This bar graph represents the disciplinary distribution of contributors to Science & Technology Studies. Assigning disciplines for contributors to a journal as interdisciplinary as STS raises many questions, especially if performed by methods other than asking contributors to identify their disciplines, if possible. Since time and other factors (a few authors have died, moved out of academia, or could not be found online) did not permit us to take that route, disciplines were identified based on following criteria: (i) keywords mentioned by authors in their online profiles that revealed disicplinary orientations (ii) departments contributors taught or researched in (iii) disciplines in which authors have their PhDs.
After this process, 137 different combinations of disciplines arose out of 615 contributors. These 137 disciplinary combinations were then further categorised under 23 disciplines, which map the breadth of not only social sciences and humanities, but also natural and applied sciences.
Even though this process has considerable subjectivity, the goal was to arrive at patterns that could potentially indicate which disciplines have contributed most to the journal. Most contributions have come from "STS" itself (173), followed by Sociology (148), Philosophy (46), and Anthropology (36). Out of 615 authors, disicplinary orientations of 54 could not be gleaned through this process.
However, as the next image shows, disciplinary orientations varied across three decades.
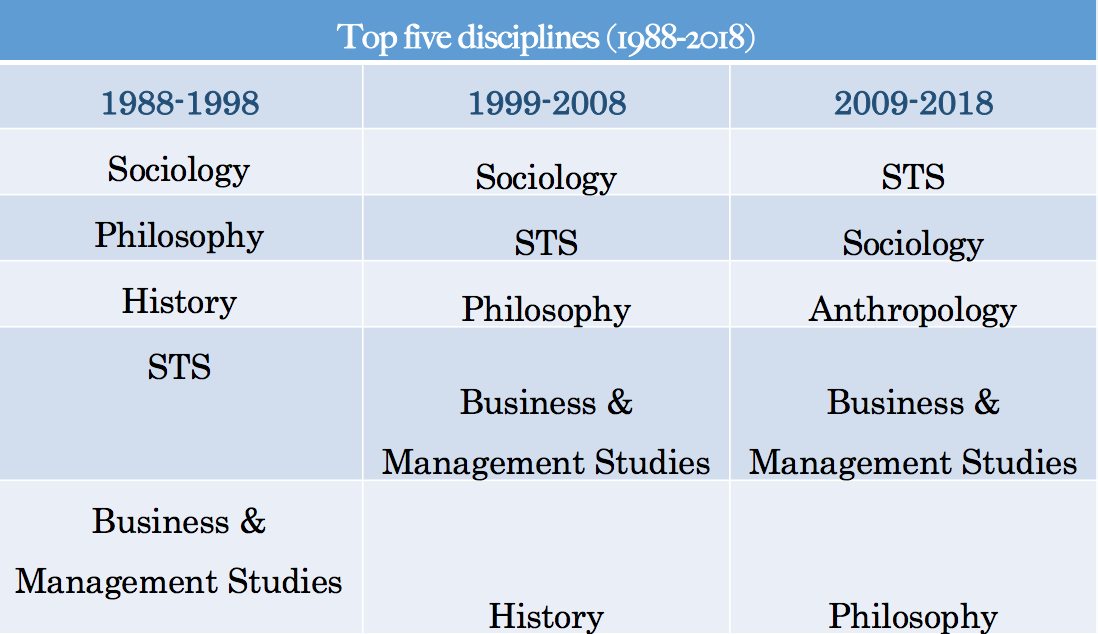
The infographic tabulates the top five disciplinary orientations of contributors to Science & Technology Studies across 30 years. If the previous image shows overall disciplinary orientations of contributors, this infographis shows that although four disciplines- Sociology, STS, Philosophy, and Business & Management Studies are consistently among the top five across 30 years, there's a marked difference in their ranking from 1988-1998 to 2009-2018. In the latter, disicplines like Anthropology, Environmental Studies and Design Studies enter the picture, and History contributes much lesser. The category of "STS" itself has shifted in ranking, with more authors identifying related keywords than before. For example, in 1988-1998, only 16 authors are categorised under "STS", compared to 119 in 2009-2018.

Prerna Srigyan. 18 August 2018, "S&TS: A Journey in Infographics ", STS Infrastructures, Platform for Experimental Collaborative Ethnography, last modified 18 August 2018, accessed 4 April 2025. https://stsinfrastructures.org/content/sts-journey-infographics