
Infographic by Prerna Srigyan
Prerna Srigyan, "S&TS: No. of contributions", contributed by Prerna Srigyan, STS Infrastructures, Platform for Experimental Collaborative Ethnography, last modified 17 August 2018, accessed 10 April 2025. https://stsinfrastructures.org/content/sts-no-contributions
Critical Commentary
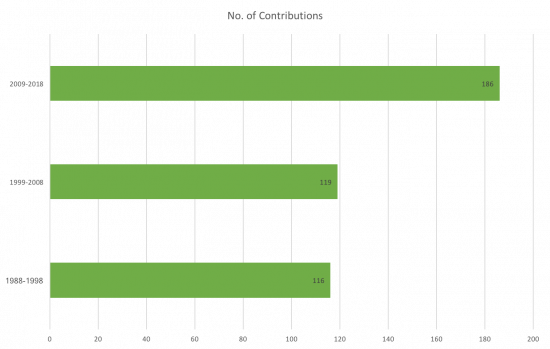
This bar graph compares decade-wise total number of contributions to Science & Technology Studies. The total number of contributions rapidly arose in 2000s, from 116 in 1988-1998, to 186 in 2009-2018.