
Kaleidos, "Charts produced in EthnoData", contributed by Jorge Nunez , Maka Suarez and Mayra Alejandra Flores Muñoz, STS Infrastructures, Platform for Experimental Collaborative Ethnography, last modified 3 December 2024, accessed 2 April 2025. https://stsinfrastructures.org/content/charts-produced-ethnodata
Critical Commentary
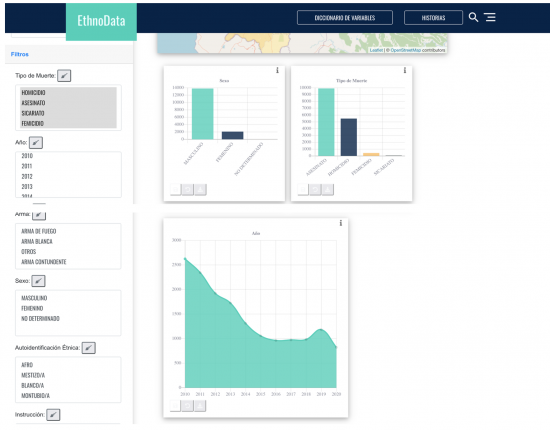
Example of a charts created in EthnoData's visualizer. For a better view of the graphs, and for more informative and better quality images, please visit the platform's visualizer: https://www.ethnodata.org/es-es/dashboard/